Welcome to Vitaminise Data Analytics

Vitaminise Data Analytics is a data visualization solution for insurance companies. Capture and analyze data ingested from Vitaminise Mobile App, Chatbot, Web Portal, and Customer Feedback Tool to track metrics on sales, claims, and customers. With this information, you will be able to optimize your up/cross-selling strategies and understand where most of your sales and marketing efforts should be targeted.

Contact us
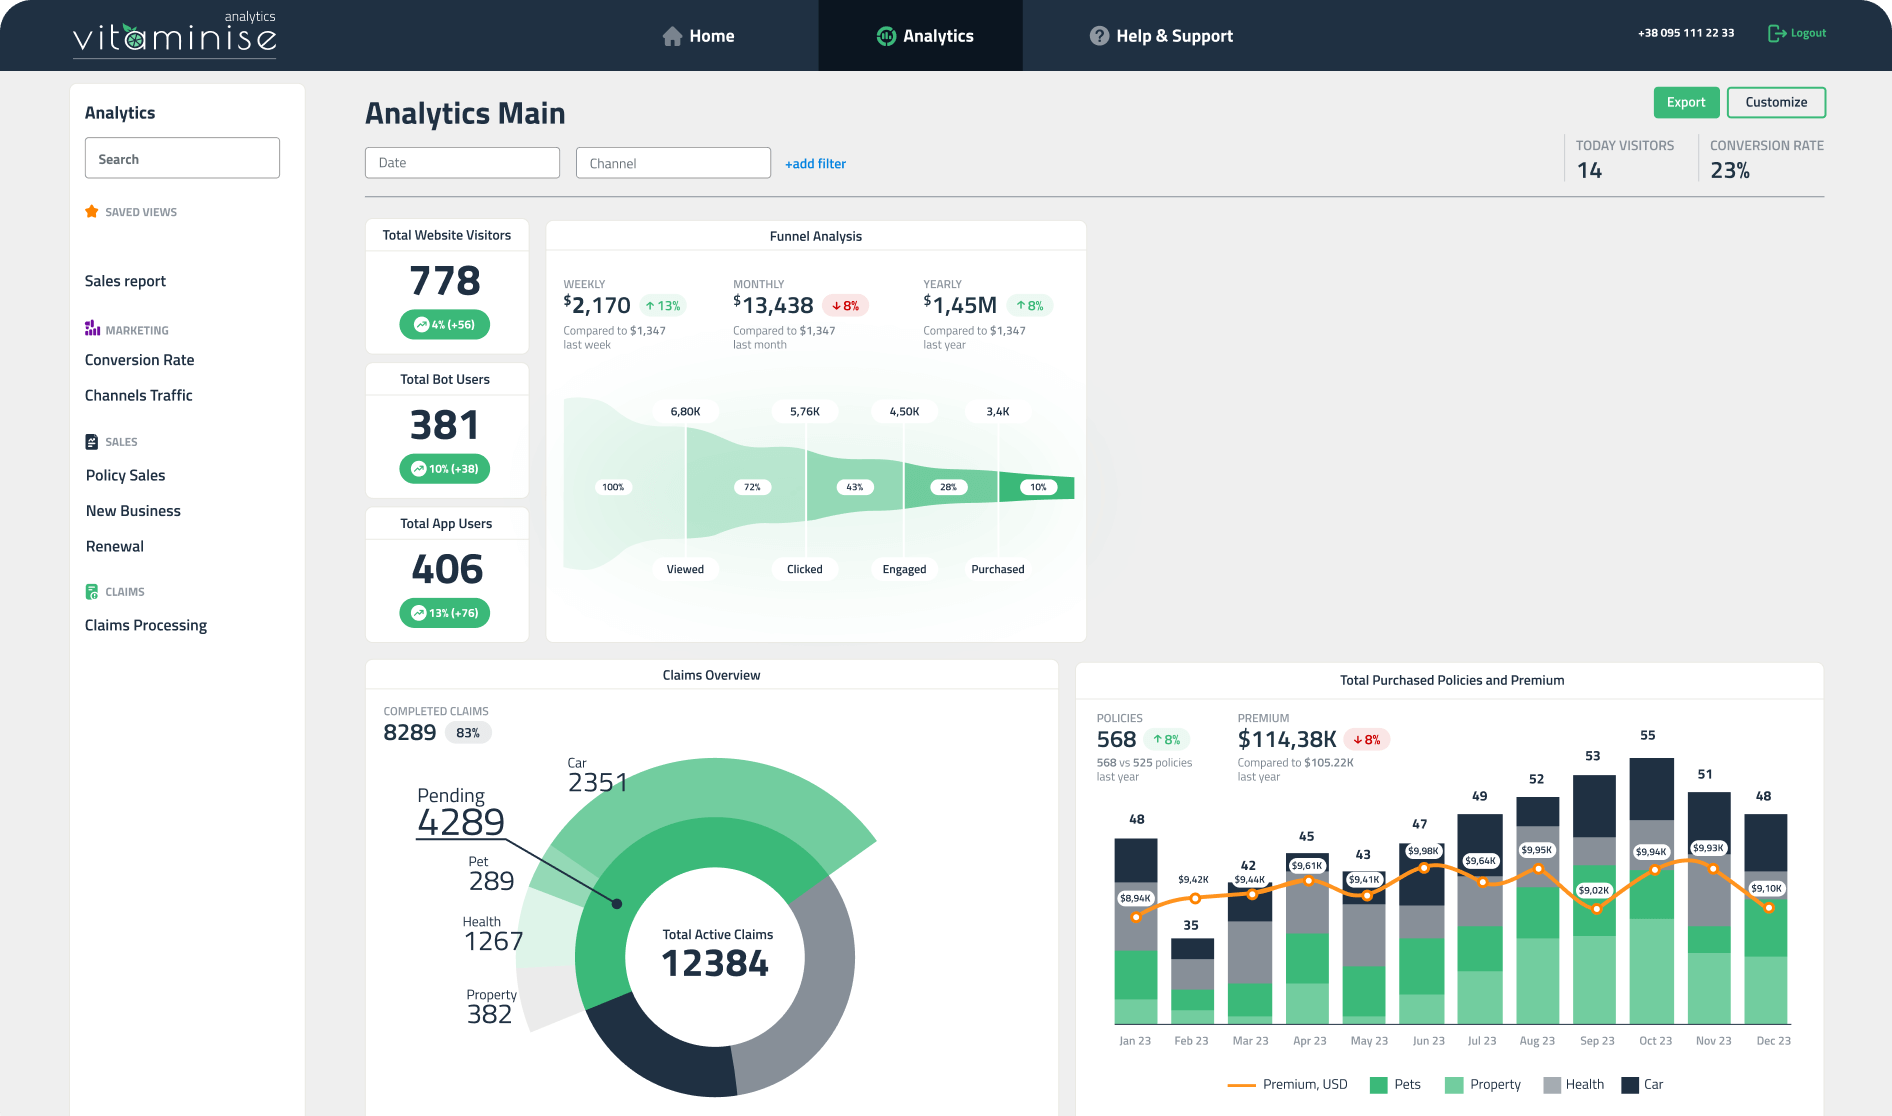
Analytics Dashboard
Analytics Dashboard
Analytics Main

Sales dashboards

Sales dashboards concisely summarize key metrics of insurance business performance (insurance portfolio structure, written premiums amount, retention rate, volume of a new business). Real-time insights allow insurers to monitor business volume, track KPI on sales, and enhance their sales strategies for better performance.

Identify which insurance product is selling best in Vitaminise solutions (mobile app, chatbot, web portal), how many policies have been purchased by the insurance product, and the number of written premiums in dynamics.

> Value for business This dashboard helps carriers identify best-selling insurance products, get insights for further financial planning and forecasting, and compare performance over time.

Total Purchased Policies and Premium 48 Jan 23 Feb 23 Mar 23 Jun 23 Apr 23 Jul 23 Sep 23 May 23 Aug 23 Oct 23 Nov 23 Dec 23 Pets Premium, USD Property Health Car 35 42 45 43 47 49 52 53 55 51 48 568 POLICIES 568 vs 525 policieslast year $144,38K PREMIUM 8% Compared to $105,22Klast year 8% $9,93K $9,94K $9,02K $9,95K $9,64K $9,98K $9,41K $9,61K $9,44K $9,42K $8,94K $9,10K

Determine which channel performs best in selling insurance products by type.

> Value for business This dashboard allows insurers to evaluate the effectiveness of digital channels in selling various types of insurance products and make data-driven decisions on channel optimization, resource allocation, and marketing strategies. The company can improve customer experience and provide personalized offerings by focusing on high-performing channels.

Policies Purchased (static) +12,09% POLICIES 8% 2335 vs 2150 policiesin <period> 305 Telegram Bot 8% 457 Website 8% 83 Mobile App 8% 2335 39 Car 28 Property 10 6 Health Pets App 86 Car 120 Property 98 153 Health Pets Website 43 Car 136 Property 98 28 Health Pets Telegram Bot Purchased by Channel Car Property Health Pets Purchased by Policy Type 43 136 98 28 39 28 10 6 86 120 98 153

Monitor quotes not converted into policies for the reporting period to build effective marketing activities and increase sales volume.

> Value for business Firstly, this dashboard works as a reminder for managers to follow up with customers on unfinished quotes and help them make the final decision. Secondly, by analyzing customer behavior, the company can identify barriers to conversion and find ways to improve customer experience or meet customer expectations.

00002 Sam Masters 1(222)333445 sam008willis@domain.com Car $2300 02-12-2023 34652 Sam Masters 1(222)333445 sam008willis@domain.com Car $2300 02-12-2023 67563 Sam Masters 1(222)333445 sam008willis@domain.com Property $2300 21-01-2024 24790 Sam Masters 1(222)333445 sam008willis@domain.com Pet $2300 21-01-2024 71203 Sam Masters 1(222)333445 sam008willis@domain.com Health $2300 21-01-2024 Unfinished Quotes 6 CAR 2 HEALTH 3 PROPERTY 3 PETS NO. CLIENT ASSET PRICE DATE

Claims dashboards

Insights on claims allow insurers to monitor claim statuses, track KPIs, identify inefficiencies in claim processing, and analyze trends and patterns in claims data.

8289 COMPLETED CLAIMS 83% Claims Overview 4289 289 1267 382 2351 Pending Pet Health Property Car 12384 Total Active Claims

Check the total number of claims reported in Vitaminise solution(s), and see how many and by which policy types are pending.

> Value for business This dashboard helps categorize claims by types of insurance products, which is crucial for prioritizing processing issues and allocating resources to handle those.

Customer profile and marketing

Dashboards that allow insurers to understand their client profile, explore customer behavior, assess the effectiveness of the marketing campaigns, and improve up/cross-selling strategies.

Discover Vitaminise solutions efficiency and performance by tracking the total number of visitors on each channel. Monitor customer behavior through the sales funnel by tracking purchases, engagements, clicks, views, and conversions.

> Value for business Insurance carriers can assess the efficiency of their marketing campaigns and make necessary adjustments to improve them.

Funnel Analysis Viewed 6,80K Clicked 5,76K Engaged 4,50K Purchased 3,4K 100% 72% 43% 28% 10% $1,45M YEARLY Compared to $1,347last year 8% $2,170 WEEKLY Compared to $1,347last week 13% $13,438 MONTHLY Compared to $1,347last month 8%

Analyze which Vitaminise solution gets the highest traffic to optimize your cross-selling and up-selling strategies.

Traffic Sources and Acquisition 200 179 246 184 Mobile App Jan 23 Feb 23 Mar 23 Jun 23 Apr 23 Jul 23 Sep 23 May 23 Aug 23 Oct 23 Nov 23 Dec 23 Website Bot 180 202 200 169 175 241 256 240

> Value for business This dashboard helps insurers make more accurate forecasts on potential traffic and rethink their up/cross-selling strategies, which, in turn, can facilitate maximizing revenue per customer.

Visualize your customer profiles by segmenting clients (by gender, age, and number of owned policies).

Customer Profile 86 23 1 policy 44 112 2 policies 101 72 3+ policies 231 Male 207 Female 47% 53% 8% 8% (225) 80 18-25 years 26-35 years 36-45 years 45+ years 33 43 75 26-35 years 36-45 years 45+ years 39 145 23 438 Customers In-Force Policy Saturation (cross-sale opportunities)

> Value for business By understanding customer profiles, insurers can create personalized offerings, and adjust marketing campaigns according to demographics, resulting in increased customer satisfaction and higher profitability.

Identify which Vitaminise solution is most loved
by clients by analyzing customer reviews and satisfaction scores.

Platforms Usage and Customers Satisfaction +12,09% REVIEWS 8% 2335 vs 2150 reviewsin <period> Excellent Poor Average Good Bad 233 210 45 60 120 301 VISITORS 8% 301 vs 326users in <period> 301 Total Users 49 Telegram Bot 8% 2 quotes 34 WhatsApp 8% 2 quotes 29 Viber 8% 189 App 8% 5 quotes Avg Score 3.8

> Value for business By understanding customer preferences, pain points, and challenges better, insurance companies can improve customer experience and loyalty.

Haven’t you seen the dashboards you need here?

We provide data analytics development services for insurance companies, considering the indicators and data you need to visualize.

Send your request

Vitaminise Data Analytics values for insurers

By implementing Vitaminise solution(s) together with Data Analytics, insurers get the following benefits:

Explore other Vitaminise products

Request
Vitaminise demo

gartner
5/5
5 reviews
clutch
4.9/5
47 reviews

    Contact us

    100% data privacy guarantee

    Thank you!
    Your request has been sent
    We will get back to you as soon as possible

    USA (Headquarters)

    +16469803276 2810 N Church St, Ste 94987, Wilmington, Delaware 19802-4447

    Denmark

    +4531562900 Copenhagen, 2900 Hellerup, Tuborg Havnepark 7

    Poland

    +48789743438 ul. Księcia Witolda, nr 49, lok. 15,
    50-202 Wrocław

    Lithuania

    +4366475535405 Vilnius, LT-09308,
    Konstitucijos ave.7
    6th floor

    Faroe Islands

    +298201515 Smærugøta 9A, FO-100 Tórshavn,
    Faroe Islands

    Austria

    +4366475535405 Donau-City-Straße 11 - Ares Tower, 1220 Wien

    UAE

    +4366475535405 Emarat Atrium, 423 Al Wasl Area, Dubai, P.O. Box 112344

    Ukraine

    +4366475535405 Vatslava Havela Boulevard, 4,
    Kyiv